
Insights Portal
The Insights Portal is available in D2L Fall 2024.
Getting Started with Insights Portal
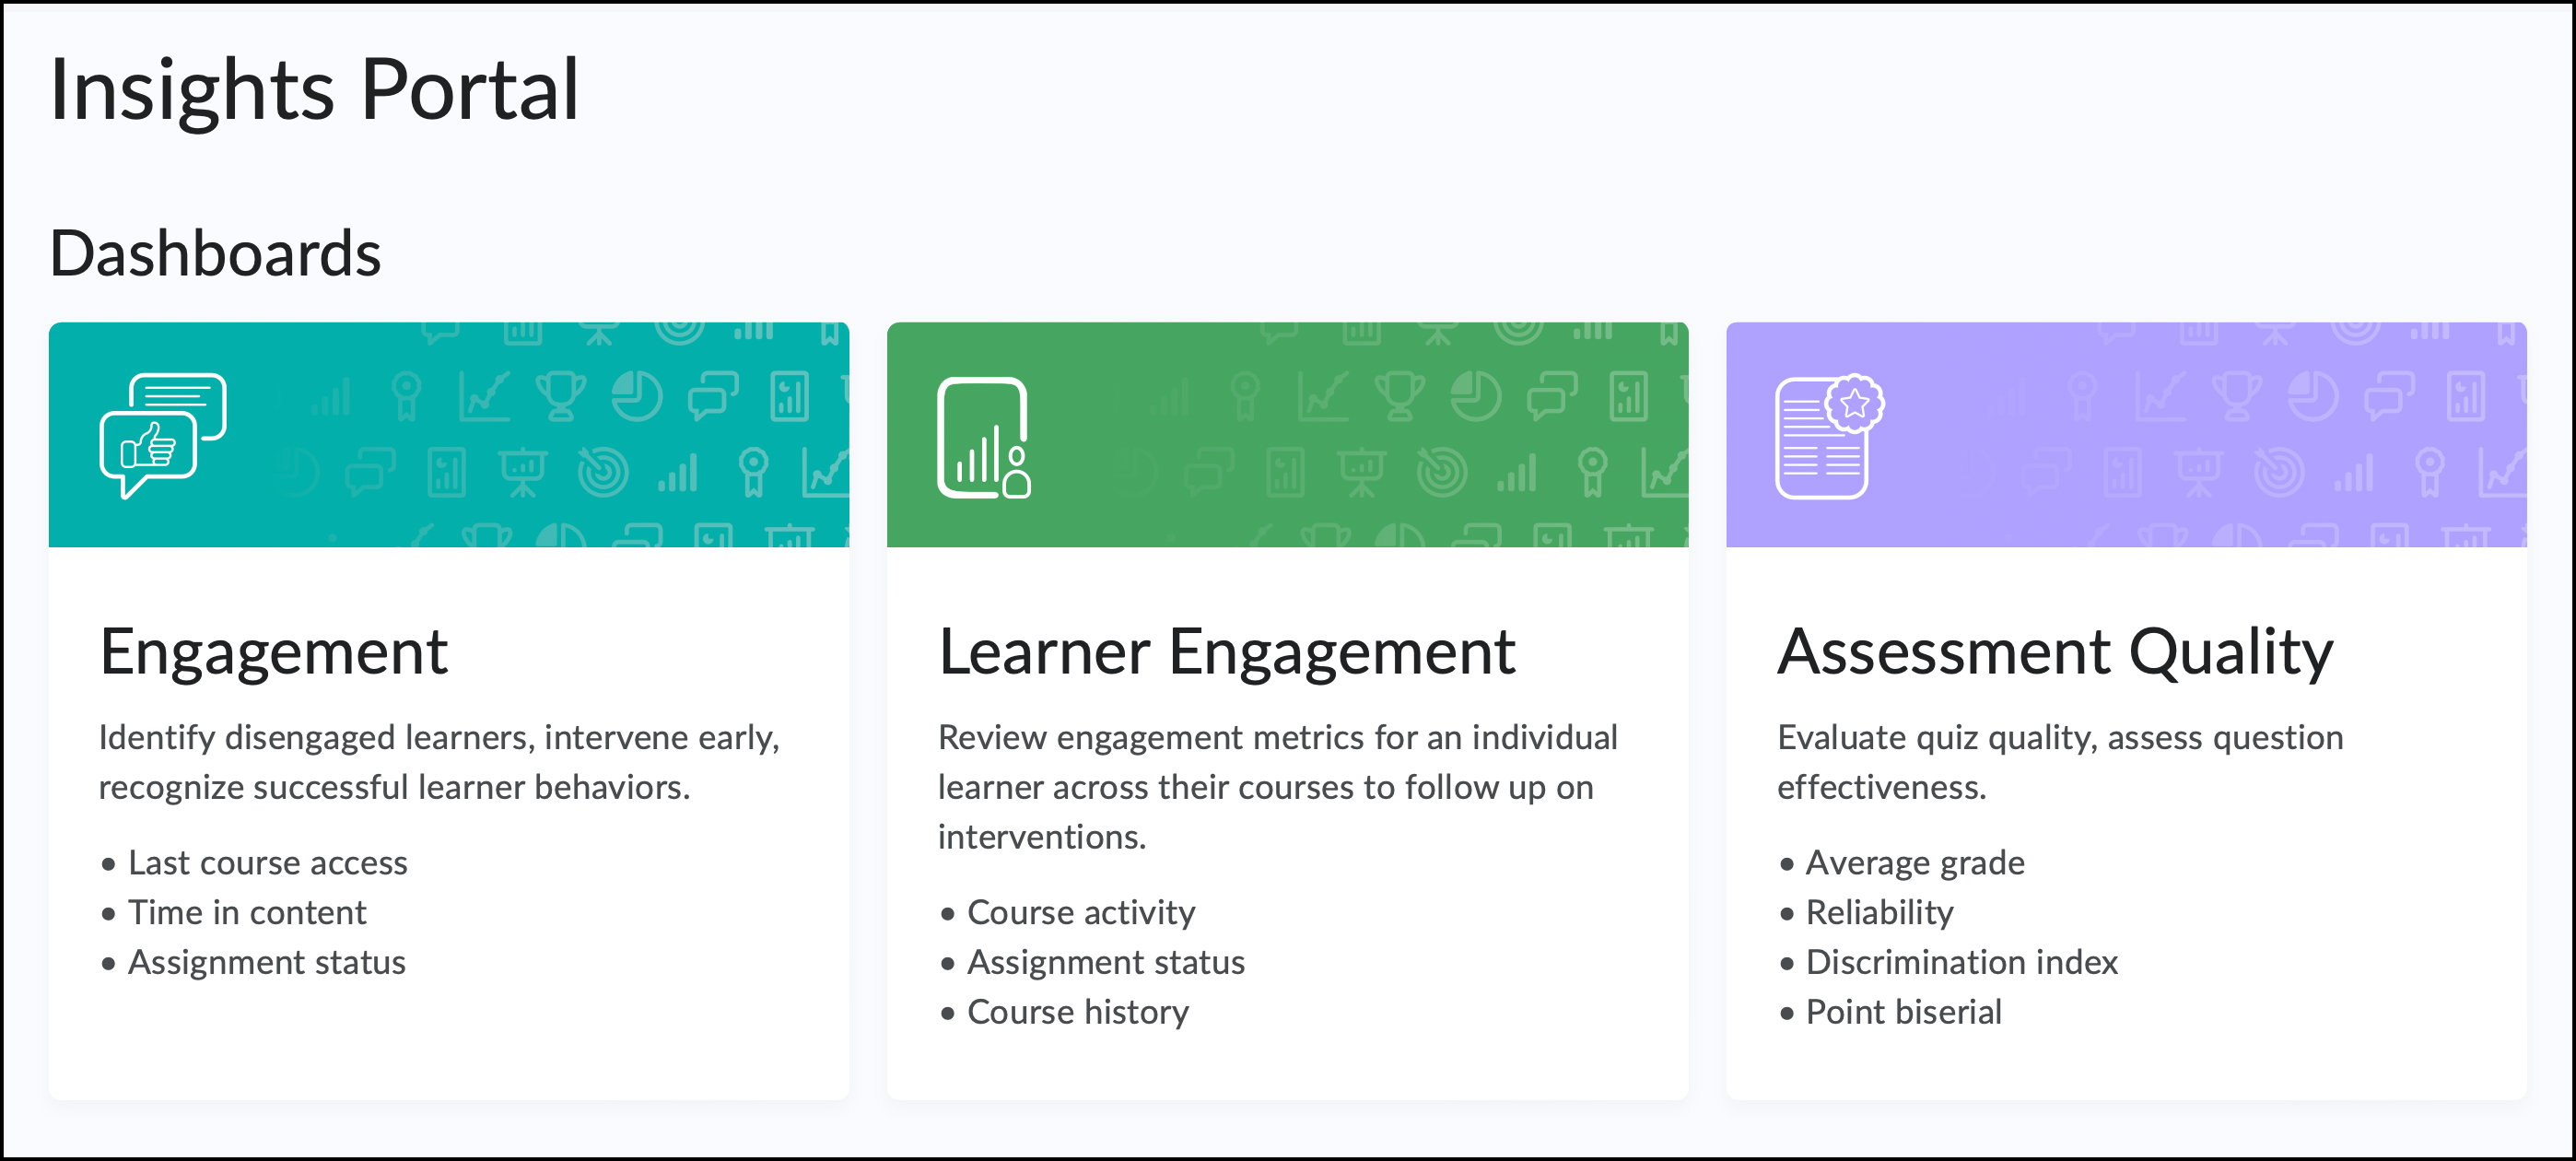
The Insights Portal includes Dashboards that provide a visualization for Instructors to track, measure, and monitor student progress in D2L courses. There are currently three Dashboards available on Engagement, Learner Engagement, and Assessment Quality.
Access the Insights Portal.
Select a Dashboard.
View and Export Data.
1 – Access Insights Dashboards
The Insights tool in D2L provides multiple dashboards that allow Instructors to access data from their courses, based on how students interact with their courses and perform on assessments.
- From the D2L My Home page, select the Online Tools dropdown menu.
- Select Insights Portal.
- Select the dashboard you want to access, including:
- Engagement – Identify disengaged students, intervene early, and recognize successful student behaviors.
- Learner Engagement – Review engagement metrics for an individual student across courses.
- Assessment Quality – Evaluate quiz quality and assess question effectiveness.
Note:The Engagement and Learner Engagement dashboards are accessible within each other, meaning you will not need to return to the Insights Portal to switch between them.
2 – Select a Dashboard
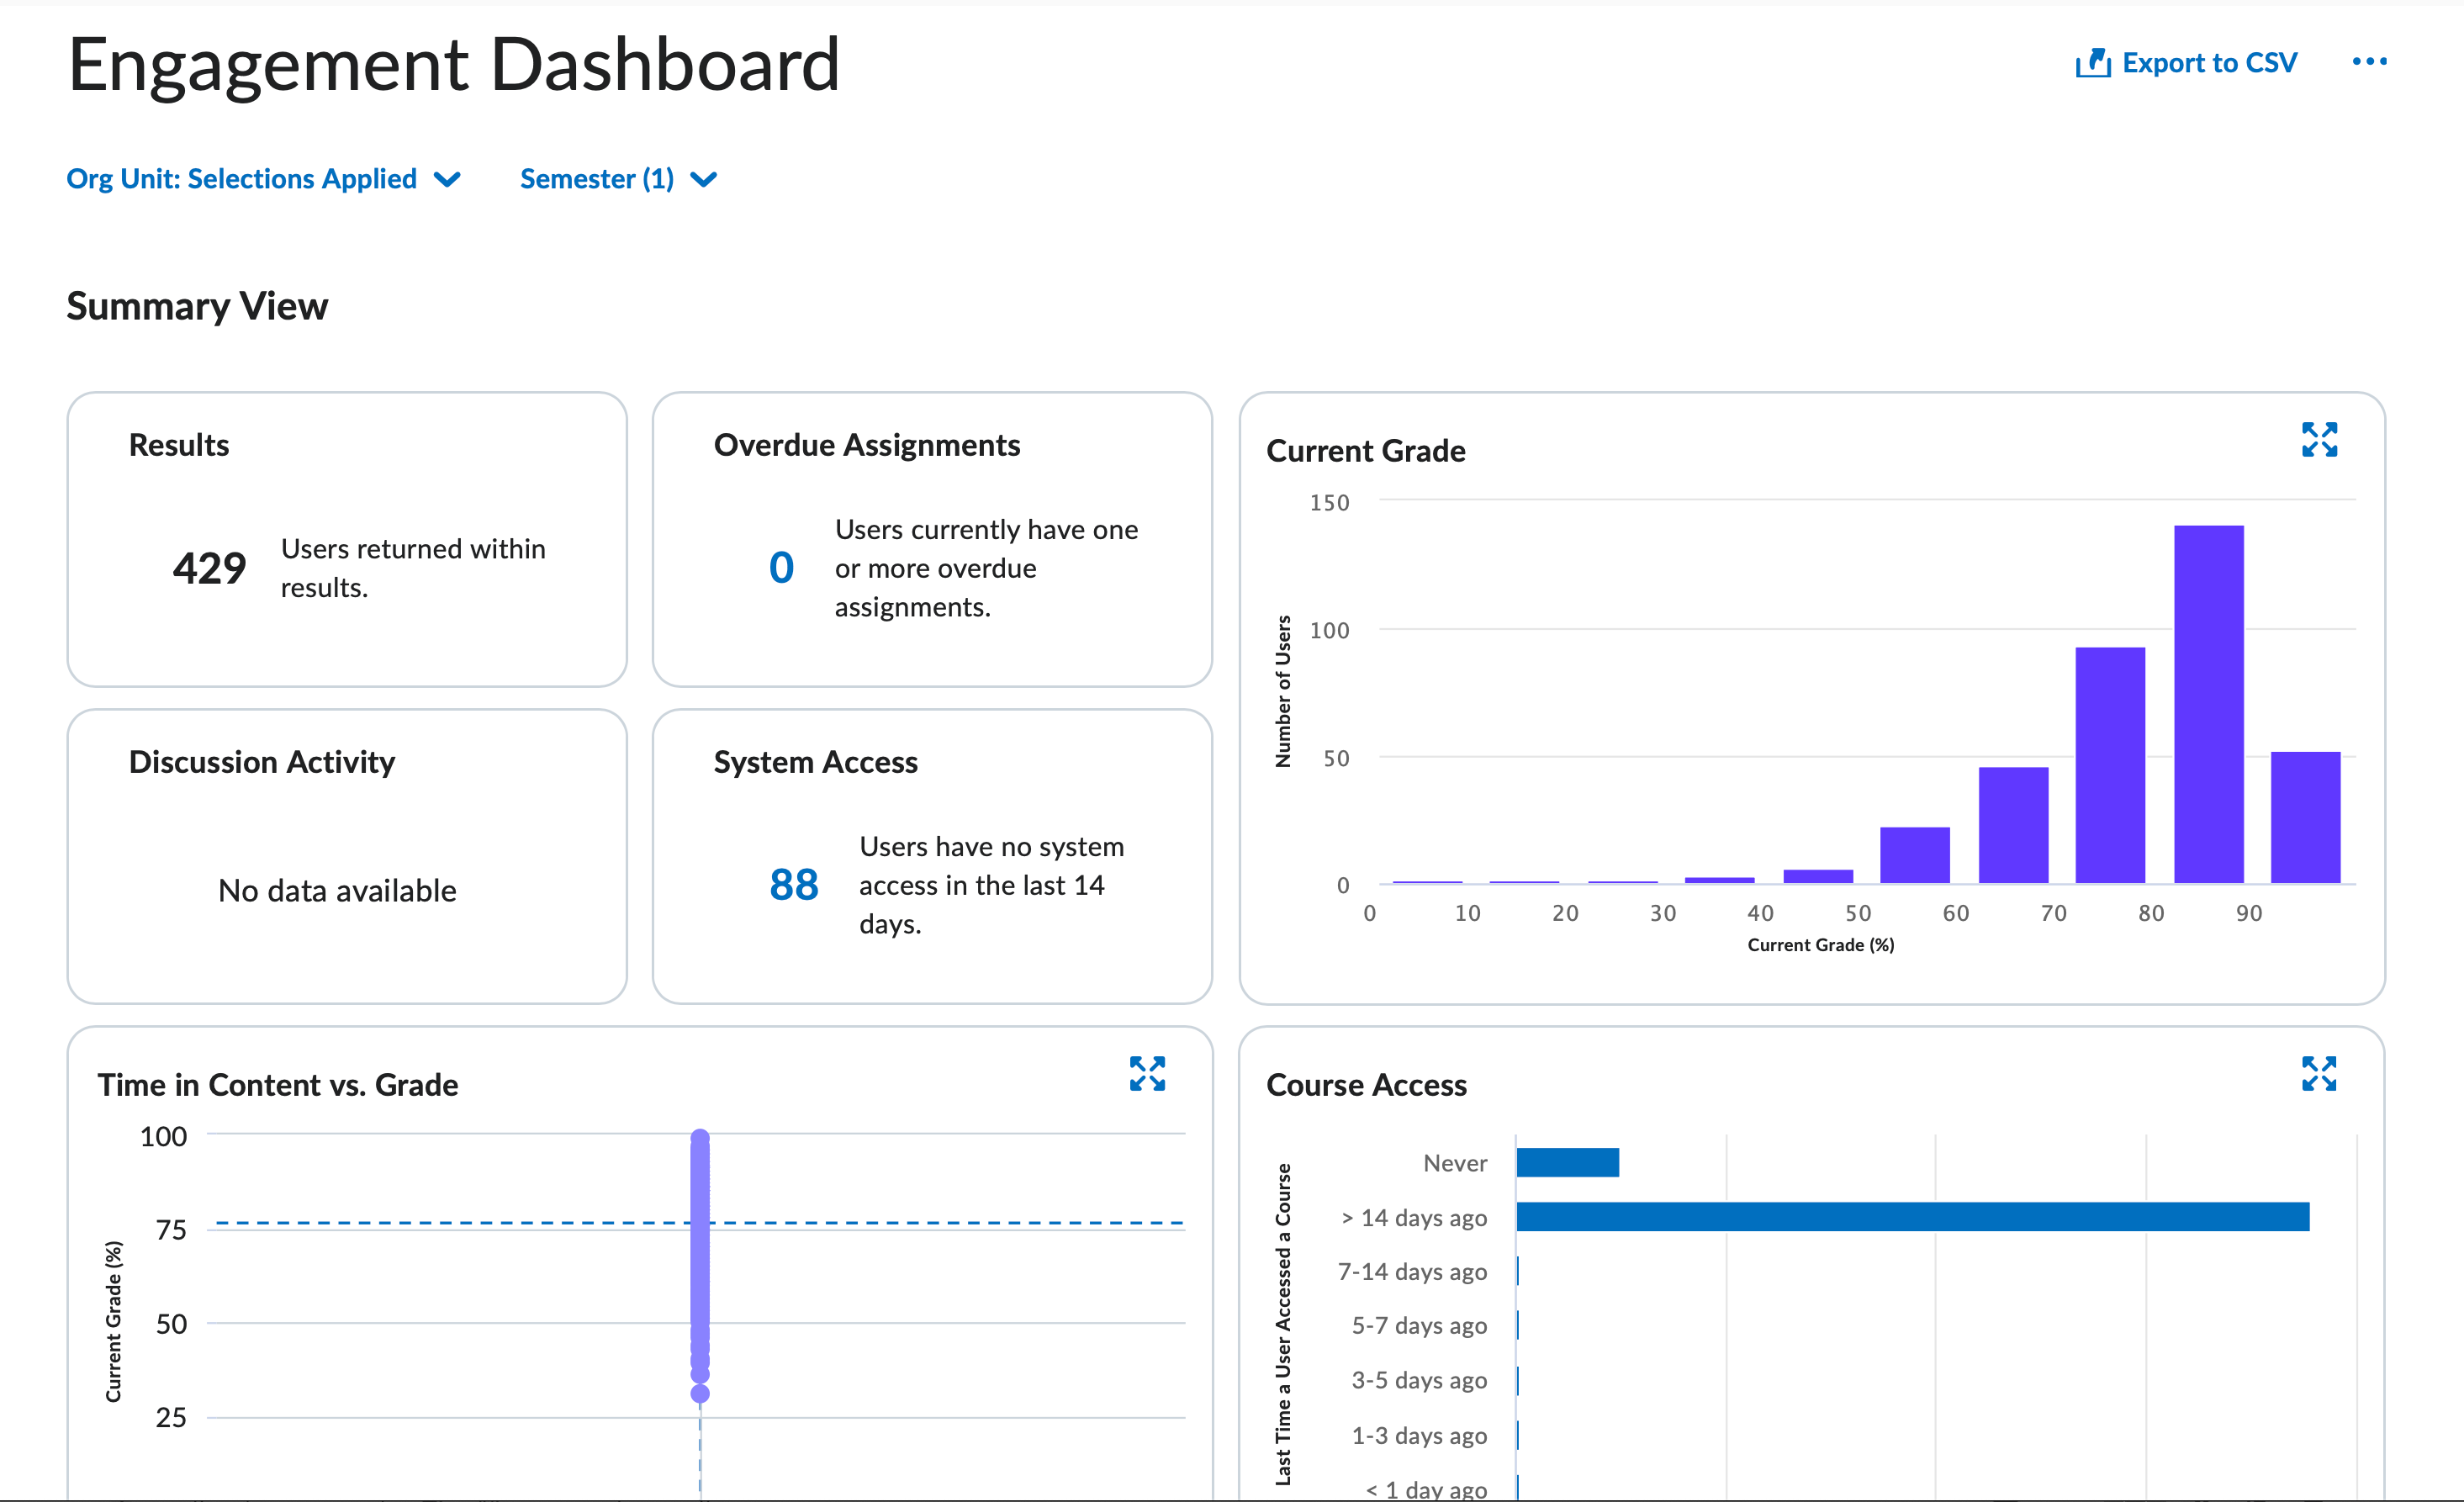
The Engagement Dashboard allows instructors to identify disengaged students, intervene early, and recognize successful student behaviors. It has two sections: Summary View and Results
- The Summary View includes the:
- Results summary
- Discussion Activity pie chart
- Overdue Assignments summary
- System Access summary
- Current Grade bar chart
- Time in Content vs. Grade scatterplot
- Course Access bar chart
- Content View bar chart
- The Results area contains a dynamic user table of learners who meet the criteria applied to the dashboard. As you add filters to the summary data, the learners listed in the User Table automatically change to reflect the updated Summary View.
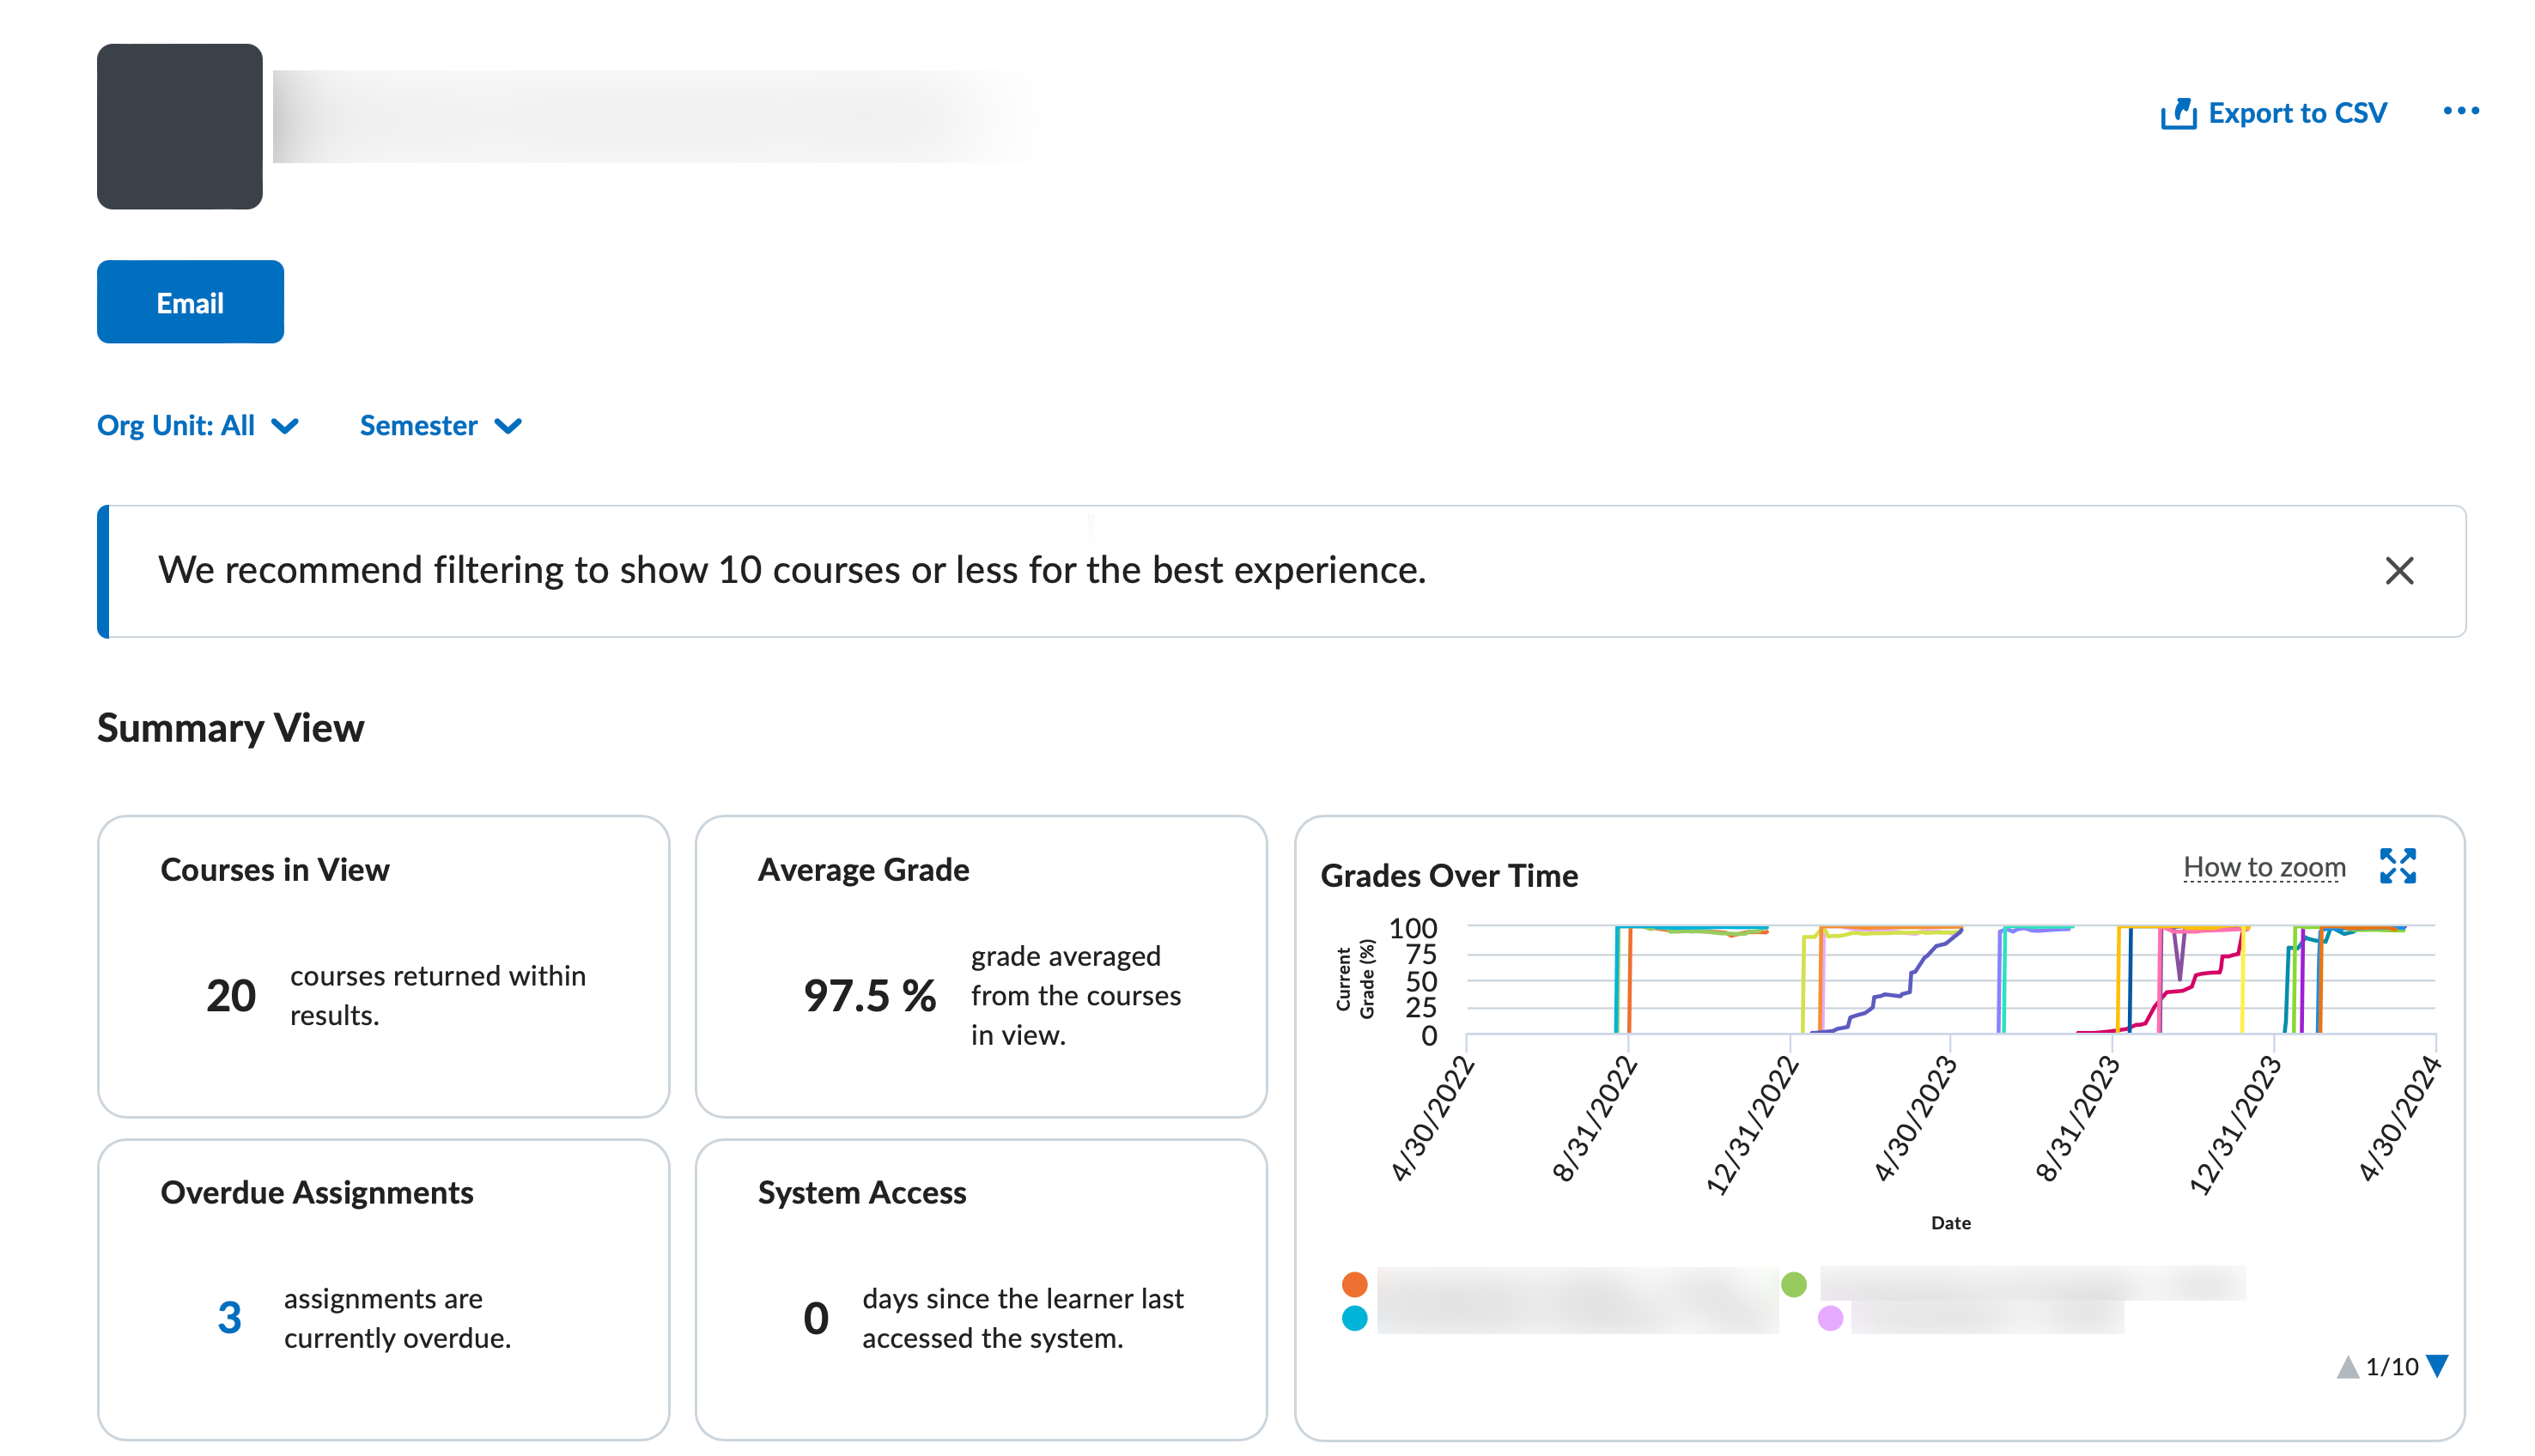
The Learner Engagement Dashboard allows instructors to review engagement metrics for an individual student across courses. It has two sections: Summary View and Dynamic Tables
- The Summary View section includes the:
- Courses in View Summary
- Average Grade Summary
- Overdue Assignments Summary
- System Access Summary
- Grades Over Time Trend Chart
- Content View Over Time Trend Chart
- Course Access Over Time Trend Chart
- Dynamic Tables list the Active Courses and Inactive Courses that meet the criteria specified by the filters.
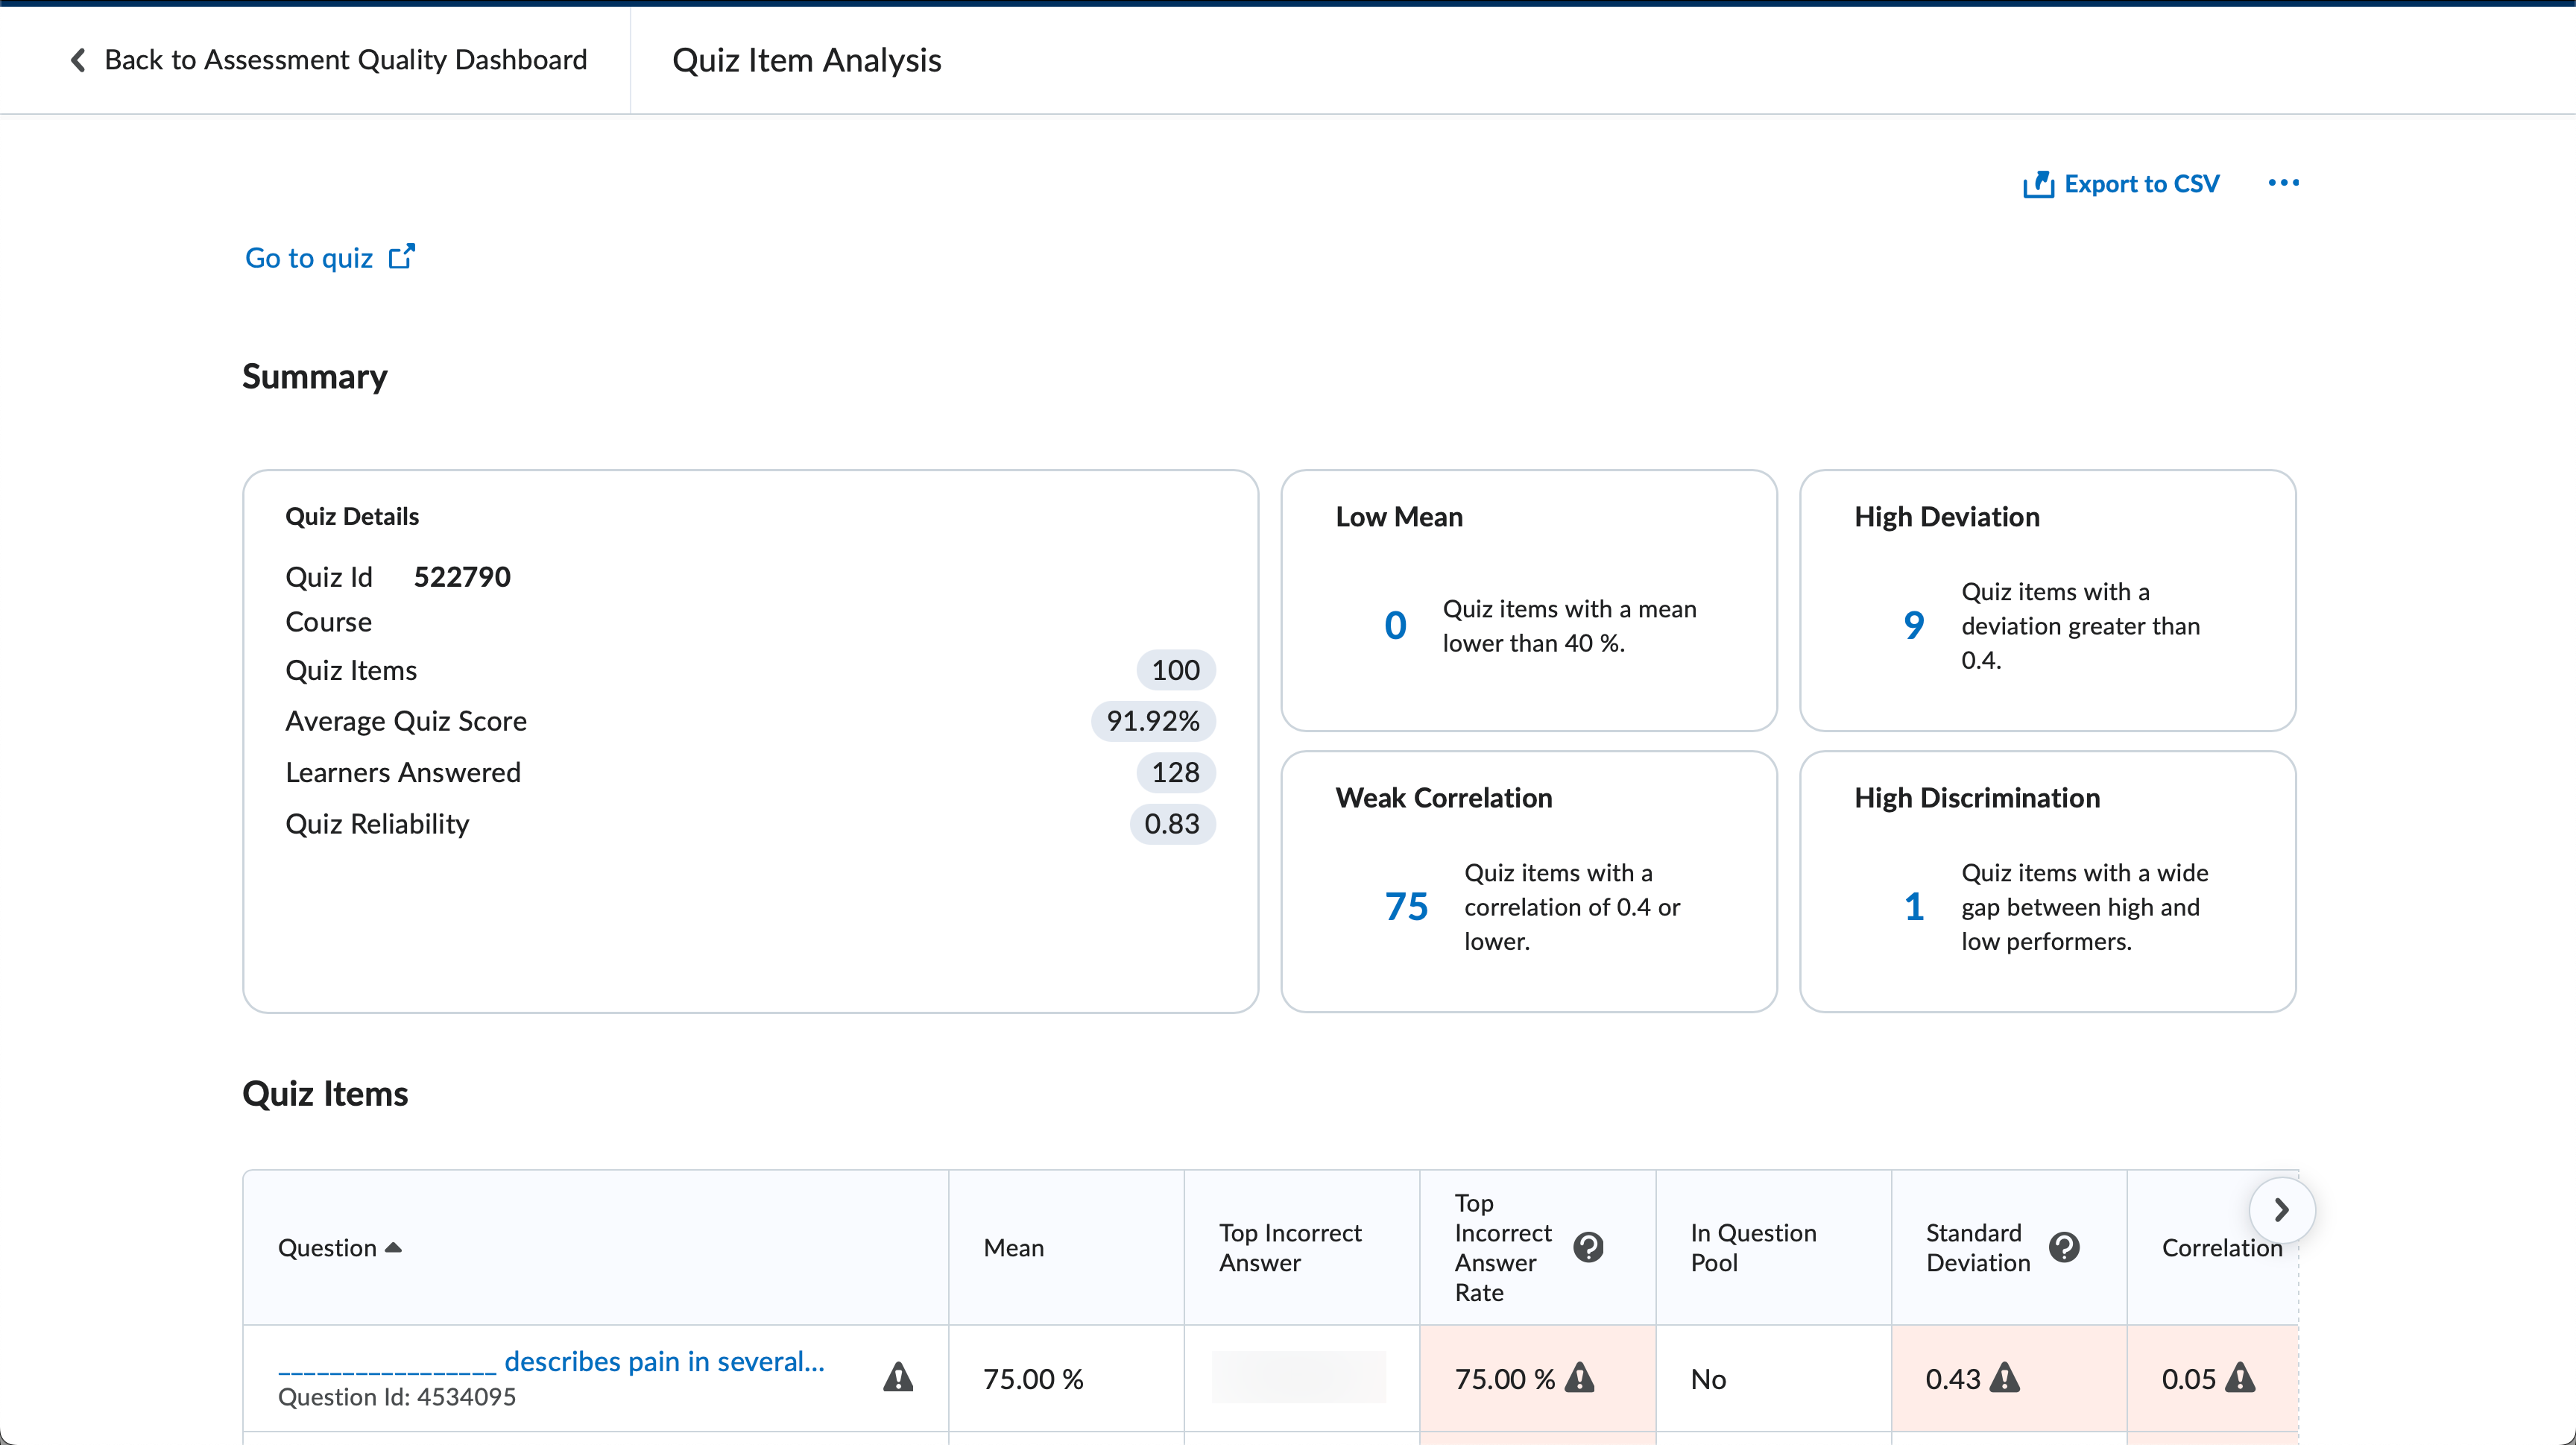
The Assessment Quality Dashboard allows instructors to evaluate quiz quality and assess question effectiveness. It has two sections: Summary and Quiz Details
Under Summary, there are cards for:
- Results (the number of quizzes that you manage and meet the criteria applied to the dashboard)
- Average Score
- Flagged Question (the number of quizzes with one or more questions that are outside the set threshold for acceptable values)
- Quiz Reliability
You can turn these cards on and off and adjust the thresholds in Settings.
The Quiz Details area contains a dynamic table of quizzes that meet the criteria applied to the dashboard. An “!” icon appears next to quizzes that have one or more flagged questions. Selecting on any of the quizzes in this table to navigate to the Quiz Item Analysis page for that quiz.
3 – View and Export Data
All of the data presented in the dashboards can be exported to CSV using the Export to CSV option in the upper-right corner of the dashboard.

Select the Export to CSV option to generate and download a CSV file to your computer.
The data presented in the CSV file will reflect all of the data shown in the dashboard with any filter settings currently applied. To receive unfiltered data, you will need to remove any filters active in the dashboard.